GETTING TO KNOW COMMODITIES DATA
The Cambridge Dictionary defines a commodity as ‘a substance or product that can be traded, bought, or sold.’ In financial markets this refers to primary products that are naturally produced, or refined, before becoming finished articles, notably, Agriculture (livestock & non-livestock), Metals, Energy and related substances. The Shipping and freight market closely correlates to commodities trading. For this paper we are focusing on Agriculture and Metals, as Energy is really an asset class in its own right.
While commodities itself is big business, with organised trading in key markets of active futures contracts, coverage of cash markets is problematic, often unstructured and reliant upon inconsistent reporting. In some large markets, agencies like the Malaysian Palm Oil Board displays quality daily auction data, yet cannot see the value of making these prices widely available, let alone monetise it, to benefit local farmers. There are problems and opportunities at the cash market level, but fortunately also pioneers like SAFRAS in Brazil recognising the value.
- 2020 Chinese Exchanges accounted for 79% of all agricultural futures & options contracts traded, followed by the US 18% (FIA/CFTC)
- 2022 $24.3 Billion, the US Commodity Dealing & Brokerage market size, growing 10.2% over the last 5 years (IBISWorld)
- Large commodity trading houses have influential shares of key market segments on a global scale, ADM, Bunge, Cargill & Louis Dreyfus jointly control 75% of the grain market, Glencore (2010) 55% & 36% of zinc & copper, Wilmar held 45% of the palm oil market
Key Commodities Data Information
- 2019 The value of Global Commodities Services Markets was $4,091 Billion, and expected to grow to $5,059 Billion by 2026, with a CAGR of 5.7% (marketresearch.com). This includes energy and others
- There are specialist commodities data vendors like AgFlow with cash, dry bulk, spot and forward rates on 75+ agricultural products
- Other specialist vendors have positioned themselves as Alternative Data suppliers rather than Commodities data businesses like Gro Intelligence, this can make searching for information harder
Commodities markets are less structured than other asset classes, and the availability, sources, and quality of data reflects this.
DISCOVERING COMMODITIES DATA BUSINESSES
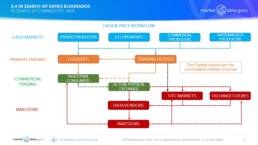
There is no shortage of commodities data suppliers or statistics, part of the problem is where the data resides. The issues come with fragmentation within markets and disconnects in the trading chain. If we crudely divide this into 4 levels, please see the below diagram, we find levels of activity providing information but without downstream flow to the investing community. We can break this down into:
- Level 1. Right at the production level and cash markets. Buying and selling conducted in unstructured markets lacking consistency, however, vendors like SAFRAS in Brazil do collect and have commercialised the data, however these are a small minority. Also in several countries, Malaysia, Indonesia, Thailand, government agencies are involved and provide daily market pricing, but do not make available in formats suitable for distribution. Economic data is widely available from countless sources but is no substitute for events on the ground
- Level 2. Here lie the great trading houses, the Cargills, Louis Dreyfus, who come into play, providing the vital link between corporate consumers and primary producers. This is closely tied to logistics and then physical delivery when transfer of ownership occurs. The Holy Grails of commodity data lies here, but this information is jealously guarded.
- Level 3. The financial markets price discovery layer comprising the physical exchange locations, OTC markets trading and exchange based derivative trading. Highly active, liquid instruments present few issues, however there is a lack of transparency as one digs further, with wider spreads and more opaque pricing
- Level 4. The home of the investor, as we can see the closest they get to the primary producers are listed companies
As commodity markets move rapidly front and centre in the news so do the players. For investors transparency only starts at the physical exchange (spot price base) level where they can rely upon:
- OTC markets (especially the Inter-Dealer Brokers) as good sources
- Exchange traded futures which are transparent, plus
- Investing in commodities businesses which will be the closest most come to the market
Disconnects in commodities markets can be observed by following and analysing the data flow.
PROBLEMS IN PARADISE
- The cash markets tend to be unorganised, lack structure, so primary market price discovery can be incomplete, inconsistent and timeliness
- Data vendors both globally and locally have tended to ignore/avoid cash commodities
- There is an over-reliance upon production figures for trading in futures and OTC markets, and only recently has it become more mainstream for investors to correlate global trading patterns (especially China as an importer) weather, satellite, and shipping data. The current Ukraine war has also rammed home the political dimension
- Companies which do possess trading data do not commercialise it or otherwise make it publicly available, such as, Cargill, COFCO, Glencore, Louis Dreyfus, however Cargill has entered the data game by offering risk and analytical services
DATA & PRICE WORKFLOW
Most investors access the commodities markets through buying into the companies that operate in this asset class. As viewed in this simplistic diagram, even for professional investors, direct participation in the underlying product is difficult, price discovery poses challenges.
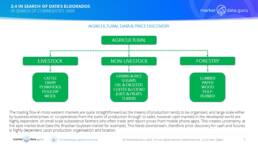
AGRICULTURAL DATA & PRICE DISCOVERY
Agricultural production is fragmented, it is also impacted by a range of factors, some of which can be predicted to an extent, i.e. weather, and others which cannot, disease, blight. Scale plays a significant role as farms range from industrial scale automated production to single farmers handpicking crops. Available infrastructure impacts data quality in terms of accuracy, consistency, and timeliness, any of which can result in distorted investment decisions.
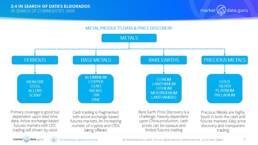
METAL PRODUCTS DATA & PRICE DISCOVERY
Metals trading is less volatile than agricultural products. Primary points of production are organised around a known number of companies, usually listed, with infrastructure and therefore output that is controlled, monitored and reported, making price discovery through the trade flow relatively transparent, except in certain segments.
COMMODITIES DATA SUMMARY
In discussions with regulators, the question of price discovery in commodity markets has been on the radar but a lower priority in the presence of other concerns. Recent events could well change that as soaring food and energy prices hits the consumer on the street.
Then price discovery comes into play, and the disconnects in the data workflow we have outlined become more apparent.
What is needed to make the markets more data friendly and open? Thoughts are:
1.Data vendors move downstream towards obtaining primary prices. This is challenging, for instance there are 37 individual markets for Brazilian corn with multiple players of varying sophistication. Multiply this by the number of different commodities located across the world, and suddenly the amount of resources and time required for data collection becomes a factor.
2.Go electronic? Well not really, the exchanges already are, and OTC markets are still some way from having a critical mass of liquidity
3.Exchange based data is readily available (China, CME, ICE, LME, & Eurex) and the inter-dealer brokers (TP ICAP, Evolution, Marex, BGC) provide comprehensive coverage
4.Innovative thinking, research the facilitators in the market, a good example Is Tradeflow Capital that uses digital technology to create products and services in the trade financing sector, providing unique insights into commodity markets
5.Once more cash data starts to become available this opens the door to index creation (SAFRAS has partnered with CTDI for a Brazilian Cash Soy Bean Index) and transparency will lead to better analytics and market modelling.
Commodity data is going to become more prevalent and available, but it needs balance across the entire market from production to consumption. Greater transparency should lead to lower costs which will ultimately benefit the average shopper and the primary producers
Conclusion. The Holy Grail of Commodities data, consistent cash prices is out there, remaining elusive. Though once the Trading Houses wake up and realise not only is serious money to be made out of their data, its value added services, analytics, and indices, it will also drive additional business back to the core trading.
Keiren Harris 08 July 2022
Please contact info@marketdata.guru for a pdf copy of the article
For information on our consulting services please email knharris@datacompliancellc.com