1.0 EXCHANGES ARE BECOMING DISSIMILAR
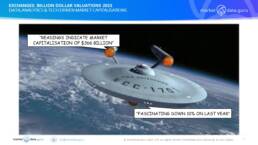
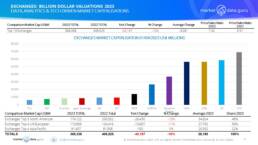
There is no doubt exchanges are valuable assets as the estimated market capitalisation on 01 April 2023 of the 13 exchanges analysed in this report was US$366,338 Million2, although this represented a decrease of 10% over 01 April 2022 with an average value of US$28,180 Million. In comparison the S&P500 was static over the same period at 4,109. However, as only 4 of the exchanges report in US Dollars1 an important element in the decline was the increased strength of the US Dollar over the year to GB£ impacting LSEG the largest exchange by revenue.
Of these, the top 4 exchanges (CME, LSEG, ICE & HKEx) accounted for 65% of total value, down 3% on 2022. Only 5 exchanges have above average market capitalisation, DBAG rounding out the quintet. Four of the top seven are based in the United States, NASDAQ being 6th and 7th CBOE which is the fastest growing exchange and based upon a low price/sales ratio of 3.3 its market cap of US$14,190 Million looks low.
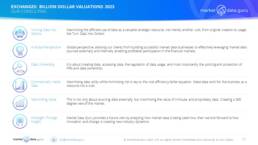
The 13 exchanges can be sorted into three basic categories with a degree of overlaps:
1.Multiple Listed and OTC Venues & Data/Analytics. CBOE, CME, Deutsche Boerse, ICE, LSEG, & NASDAQ
2.Hybrid Venues with Data/Analytics Potential. SIX & TSX
3.Primarily Listed Venues. ASX, Euronext, HKEx, JPX, SGX
While somewhat generic, this categorisation does more point to future value. Investors do appear to rate exchanges that combine the ability to use data and analytics which are high margin to drive trading into multiple venues. Exchanges listed in category 1 are the highest valued exchanges, albeit joined by HKEx, not that long ago the biggest exchange by market cap which has since dropped (to a still considerable) half its former maximum value.
Successful index businesses are playing an increasingly significant yet understated role on multiple levels. Those exchanges choosing outsourcing to an index creator likely to regret the decision.
1 Exchange rates per Bloomberg 01/04/2023
2 SIX Market Cap is a calculation based on European exchange P/S ratios
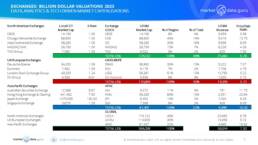
2.0 MARKET DATA VENDORS CAPITALISATION IN FIGURES
- CME Group remained the largest exchange by market cap, valued at US$68,900 Million, decreasing 19% from US$84,900 Million representing 19% of the 13 exchanges total
- Only four exchanges saw their market capitalisation increase from 2022 to 2023, Deutsche Boerse (+26%), TMX (+16%) CBOE (+14%) and HKEx (+5%)
- All the other exchanges saw their market caps drop, most notably LSEG which fell from US$73,837 Million to US$56,381 Million (-24%). To be fair LSEG can point to unfavourable movements in FX rates for the change
- The smallest exchange was TMX whose market cap increased to US$6,022 Million from US$5,212 Million +16%
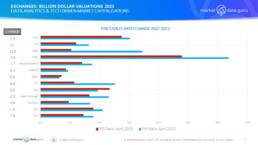
- Despite high revenue growth CBOE has the lowest Price/Sales ratio of 3.3 with HKEx having the highest at 23.9
- However CBOE was one of only 2 exchanges with positive Price/Sales ratio change since 2022 with 0.3, the other ASX with 2.0
- The Asia-Pacific exchanges besides HKEx make up 7%, of the total market cap, the same as NASDAQ alone
- SIX is the only exchange in the report which has not listed and its market cap was calculated by multiplying the average Price/Sales ratio of the three listed European exchanges by SIX’s 2022 revenues
3.0 EXCHANGES FUTURE WORTH
Realistically the chances of one exchange acquiring another is exceptionally low at present:
1.Political. Exchanges outside Europe and North America are considered national status symbols, few are listed and where they are any takeover attempt unlikely to be welcomed. In Europe the few remaining independents are not listed (Börse Berlin, Bucharest Stock Exchange, Hamburger Börse, Wiener Börse which also owns Prague Exchange) or are listed with significant government influence (Athens Exchange Group, Bulgarian Stock Exchange, Warsaw Stock Exchange)
2.Regulatory. There is an anti-exchange mood extent, and a merger between any of the largest exchanges unlikely to pass scrutiny
This means for exchanges to grow their businesses they need to enter new markets, i.e. buying OTC electronic venues, perhaps one might be tempted by an ultra-cheap Interdealer Broker, and/or expand clearing services.
The best way and the most obvious strategies are to follow the path of DBAG, ICE, LSEG, and NASDAQ by non-organically buying into trading platforms, data and analytics, services pro-actively driving trades into their venues. Their index businesses are playing a pivotal role in the data workflow. This ticks the right boxes of attracting investing moths to the flames of data and FinTech. Big Tech is not forming alliances with the top exchanges out of any altruism, its all about pushing productivity to their Clouds, in return these exchanges increase their global footprints. A win-win for the partners, possibly not for the data consumers.
4.0 SUMMARY
Can we still call them exchanges? The future value of the biggest exchanges is right now being driven by the twin pillars of 1. data and analytics and 2. new technology enabling connectivity, accessibility and productivity, i.e. The Cloud. Exchanges realising this are capitalising on potential.
This will be detrimental to smaller exchanges whose only strategy is inertia derived from legacy thinking. In stark contrast, smarter exchanges recognising data, analytics and tech are not only enablers, but wonderful levellers as well will thrive.
Keiren Harris 25 April 2023
For our information on our consulting services please visit www.marketdata.guru/data-compliance
Or Email knharris@marketdata.guru
General contact info@marketdata.guru and to obtain a pdf copy of the article