SMALL INCREMENTAL INCREASES QUICKLY ADD UP
As a small progressive financial institution with a global interest in equity, fixed income and related derivatives, the client has been a keen adopter of analytics and related solutions to facilitate investing. This generates a broad need for information services going beyond the simple requirement for real time information. The data workflow is fundamental to their business.
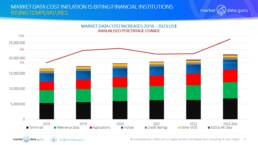
During the period under review starting in 2018 and extrapolating to the end of 2023, MDG found the client’s market data spend increased by just over 28%, varying between 3% and 5% pa between 2018 and 2022 but then suddenly accelerating away in 2023 to 9%. The client had been pro-active over the period and to control spend and limit adding new services, especially during COVID.
MDG reviewed the spend, classifying segments by utilisation, and for the purposes of this article divided them into seven basic areas (though for the project the categories were more specific).
By far the greatest market data cost segment remained terminals/display accesses, (32.3% of spend), followed by Reference Data (25.2%), however the largest increase in overall dollar terms highlighted enterprise and application usage (+41.5%) as financial institutions expand automated processing. COVID had a direct impact here because as users were forced out of the office to work it necessitated more reliance upon electronic connectivity.
ESG and Alternative data saw the largest percentage increase as a segment (75.4%) though from a very low base.
GROWTH IN MARKET DATA SPEND UNEVEN BUT ONE DIRECTION ONLY – UP
Two standout features of this client and other projects MDG has advised on is the more volatile the market, the more active the client is which drives costs in two specific areas:
1.Application and enterprise usage as the client shifted towards more automated processing of data from pre-trade to post trade
2.Increase in the requirement for reference data and corporate actions to match the trading
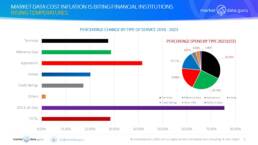
Over the 2018 to 2023 period and across our seven segments the trends MDG revealed were primarily:
1.Terminals: +27.5% & 32.2% of spend in 2023. Major factors Bloomberg terminal contract rollovers and exchange fees price rises
2.Reference Data: +28.7% & 25.2% of spend in 2023. Increased ingestion of corporate actions, price data and LEIs, plus regulatory diktat
3.Applications: +41.5% & 19.0% of spend in 2023. More automated processing of data, especially trading engines, pre & post trade services
4.Indices: +20.1 & 15.1% of spend in 2023. Same level of index usage, renegotiation of contracts with higher fees in 2023
5.Credit Ratings: +17.2 & 4.0% of spend in 2023. Same level of credit ratings usage, renegotiation of contracts with higher fees in 2023
6.Other MDS: +1.7% & 3.1% of spend in 2023. Niche services providing specific information not available elsewhere
7.ESG & Alt Data: +75.4% & 1.5% of spend in 2023. Regulatory and market driven, risk and compliance driven
This reveals an uneven growth in market data expenditure, what it does not do is show the difference between costs increasing because of greater associated data usage and rising fees. From this perspective we could see:
1.Greater usage drives costs for reference and associated data, applications and ESG & Alt Data
2.Higher fees were more responsible for cost inflation for terminals/accesses, Indices and Credit Ratings
SUMMARY & CONCLUSIONS
Prior to 2023 the growth in overall market data spend was incremental and budgeted because although costs were rising higher than general inflation it was accompanied by an acceptable increase in data consumption beneficial to investing.
However in 2023 the cost/consumption relationship has been flipped over whereby increasing market data fees is not being matched by commensurate added value from data to the investment process.
The key to this assertion would be to analyse trading, then comparing volumes and values to directly associated costs. As the shift to electronic data processing gets larger the ability to do this will provide market data and finance managers more information upon which to base future strategies.
In the meantime there are first class management tools available.
If we view our financial institution as a bellwether as to what is happening in terms of balancing future costs versus business value we see:
1.Overall desktop usage remained stable, but costs are steadily increasing year on year, it is the old ‘frog boiling’ analogy
2.Greater use of applications requires a more hands on approach to data ingestion and this is where options in The Cloud are coming to the fore. Increasing use and number of quants coming with high data demand is skewing market data expenditure towards this type of usage
3.Reference data costs have become a serious concern, again partly driven by data modelling
4.Indices and Credit Ratings providers are now forcing their customers to consider radical (to them) options
5.ESG and Alt Data is making its presence felt more in terms of a perception than cost right now but the trend is definitely upwards
For the Financial Institution determined to combat market data inflation, legacy tried and true strategies are not going to be anywhere near enough, more detailed workflow analysis is required to drive development of effective cost controlled market data strategies
We advise on market data strategies, sourcing, and cost savings. Contact us today to arrange for innovative unbiased advice.
Keiren Harris 22 August 2023
Please contact info@marketdata.guru for a pdf copy of the article
For information on our consulting services please email knharris@marketdata.guru
#marketdata #marketdatacosts #datalicences #datamanagement #dataownership #thecloud #ESG #Altdata