US$42.2 Billion
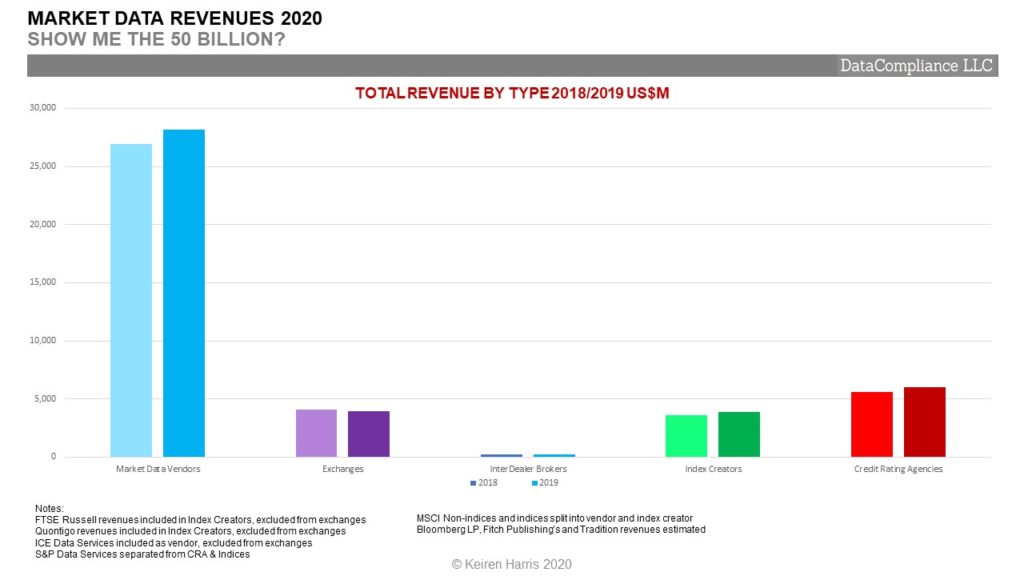
In 2019 the leading 43 players in providing market data services had combined estimated revenues of US$42.223 Billion (50 Billion just trips off the tongue better). This excludes large players from China and Japan, medium tier global market data providers, and the universe of smaller niche companies whose revenues would push towards the US$50 Billion mark.
If we divide the market into 5 segments, market data vendors, exchange data, inter-dealer brokers, index creators, and credit rating agencies, significant variances can be identified. Although this has become somewhat simplistic due to the increasing competitive overlap between companies across the segments.
Key Points
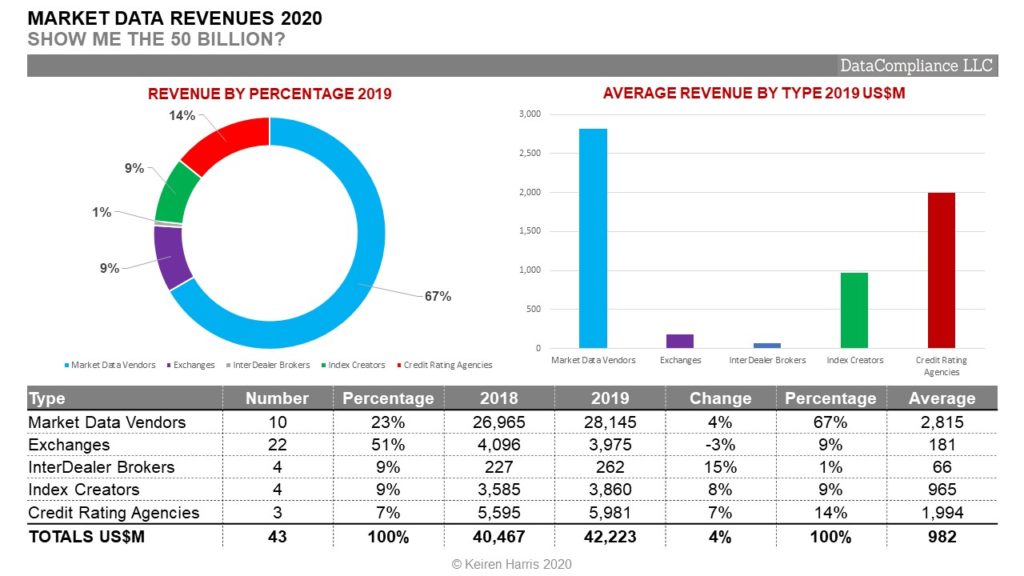
• Top 10 Market Data Vendors account for 67% of market spend, US$28.145 Billion, though they are very diversified with their trading venues, platforms, indices, news and expanding RegTech on top of bread and butter aggregated data and analytics services. Disintermediation and desire to unbundle information services poses a threat along with more direct competition
• The market potential for just plain price data is limited by the number of vendors and investing institutions, which explains to a degree why exchanges and IDBs share just 9%, of the total market, US$4.237 Billion, but account for 60% of the 43 suppliers. Though these constraints are due to articifical self-created constraints
• Exchanges’ 2019 revenues actually dropped 3% over 2018 (FTSE Russell & Quondigo are counted as index creators and ICE Data is included in the market data vendor totals)
• The 4 index creators and 3 credit rating agencies, original works creators where data IP and licences transition from source to new works account for 23% of total revenues, US$9.841 Billion (S&P is divided into separate Index & CRA entities). Incredibly hard to change vendors once hard wired into businesses, ‘Brand‘ plays a significant, yet understated, role in their success
• Creating value around data usage has supplanted the delivery of vanilla data products and services
• Increasing competitive overlap blurs the distinction between the segments to the point of elimination
The Road to US$50 Billion
Data saturation is an issue that impacts growth, not in terms of quantity, there are mind boggling amounts of data constantly being churned out, but closer examination reveals it includes only limited amounts of new original raw data. The money is all in what you can do with that data.
Exchanges and IDBs are getting the message. Leaders like ICE, and the LSE recognised early on it is not only about the data per se, but what the users do with it. The luxury of large active markets have given the big exchanges a head start their smaller brethren can only dream about, by expanding rapidly into the value-added data world
An area of convergence is by adding value to original price data, i.e. creation of new data, like indices, or providing analytical services. Taking raw data, building actionable insights, investment decision tools, and performance benchmarks
Takeaways
• The average revenue in 2019 of all 43 data suppliers was an estimated US$982 Million. This will shift upwards but the ratios between the segments will change in favour of IP driven businesses
• In 2019 the average revenue of market data vendors is US$2.815 Billion, but this is skewed by the size of Bloomberg and Refinitiv, and the omission of a multitude of vendors (Look out for Infront) in the sub US$1 Billion pa revenue space, as well as the development of new channels to market. Lightweight Tech reduces the ability for vendors to lock clients in
• Most exchanges still make most of their money from vanilla price data services, and once FTSE Russell, Quontigo, ICE Data Services are placed in their individual categories the average revenue is US$181 Million in 2019. Also they are reliant upon Bloomberg and Refinitiv either directly or indirectly for 60%+ of income. Increasing revenue means moving to smarter pricing models and developing a better understanding of what their clients want from data
• Inter-Dealer Brokers are unsurprisingly the smallest segment, with only 1% of the total market data revenues with an average of US$66 Million, however as a segment when added to OTC trading venues (ATS/MTF) offer exciting potential. OTC data sourcing is fragmented, and the IDBs need to find a way to marry electronic trading data with high value hard to get illiquid market pricing
• Equally unsurprising is the success of the index creators with an average revenue of US$965 Million, driven by the growth in passive funds, the need for benchmarks, and opening up of OTC indices, with the rise of a new breed of index creators
• The second highest average revenue segment, are the Credit Rating Agencies, US$1,994 Billion, with only 3 truly global agencies and effectively a closed shop, this is arguably the most profitable market data business to be in. Monetary authorities are failing in their objective of opening up the ratings market by encouraging the development of local competitors. Large corporations know what their investors want to see
Trends
Too often market data gets looked at in isolation from the financial markets which drive its production and to which it serves. So it becomes too easy to miss the key trends that have already occurred and now expanding the process, i.e. the growth of automated data usage, driven by analytics, the creation of new IP in the form of benchmarks, evaluated pricing, and ratings. So there is value in considering future trends in the near term.
Final Thoughts/A Malaise?
• A tiny 4% (admittedly over only 1 year) increase in overall revenues seems to indicate malaise, yet hides the plethora of new specialist data providers springing up, and the willingness of both vendors and exchanges to buy them
• There is data saturation in the leading financial institutions, the number of terminals on desks are at best static, and the demand for datafeeds needed are more the product of competition than growth
• There is danger in market data suppliers competing for a greater share of an existing pie instead of baking a bigger pie
Final Thoughts/A Renaissance?
• Yet the 43 covered in this article does not encompass the myriad of smaller and innovative companies that exist and are springing up
• It ignores the growth in new IP which is expanding from a lower base than the traditional market data vendors
• Appearing are new types of market data players, the data malls, third party processors and facilitators which are changing the face of market data workflows, such as,
• FinTechs in the Wealth Management space, RegTechs need data to function, none of which has yet to be truly exploited
• Finally the market data industry has become so wedded to financial institutions (understandably) it finds it difficult to embrace a new era of untapped larger markets, probably because they are low margin, i.e. the mass media, HNWI, and retail, both philosophically or by developing business models able to take advantage of these opportunities
Keiren Harris 25/11/2020
www.datacompliancellc.com
Please email knharris@marketdata.guru for a pdf or information about out consulting services